
When you enhance your code with aspects, debugging changes. With PostSharp, patterns are implemented in classes that are separate from the business logic. Most of the time, you will want to debug just the business logic. Sometimes, you will want to debug the aspects, but the debugger skips aspect code by default during step-into sessions and in the call stack window.
Stepping into aspect code
Suppose you have a SayHello method intercepted by an Intercept aspect. You are about to step into the SayHello method. By default, the debugger steps over the code of the Intercept aspect and then breaks at the beginning of the SayHello method. When Step Into Aspects is enabled, the debugger steps into the Intercept aspect.
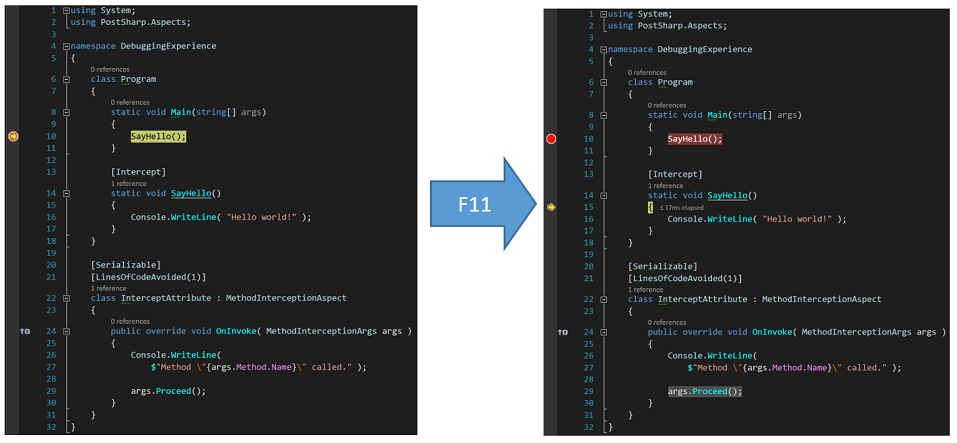
The Step Into Aspects feature is disabled by default. To turn it on, go to the menu PostSharp / Options, then to the General tab and the Debugging section, and check the Step Into Aspects check box. Now you can step into aspects using the Step Into (F11) command of the debugger.
Showing aspect code in the call stack window
By default, all the calls to the methods of the Intercept aspect are hidden behind one stack frame named [Aspect Code]. Suppose you have the SayHello method intercepted by the Intercept aspect, as in the example above. You are inside the SayHello method. In the call stack, all the methods introduced by PostSharp are hidden.

Sometimes you may need to see the real call stack that includes all intermediate method calls generated by PostSharp. This is the purpose of the Show Aspects Code in Call Stack feature.
To turn it on, go to the menu PostSharp / Options, then to the General tab and the Debugging section, and check the Show Aspects Code in Call Stack check box. Now, the call stack includes all the methods introduced by PostSharp.

Disabling debugger enhancements
PostSharp improves your debugging experience by installing extensions for the Visual Studio Debugger and by enhancing PDB files during the build. In some use cases you may want to disable these PostSharp debugger extensions and revert to the default debugging behavior in Visual Studio (for example, when you build for a new or unsupported target framework, debug code on unsupported devices, or work around bugs).
To disable PostSharp debugger extensions:
Right-click your solution in the Solution Explorer and then click Properties.
On the PostSharp page of the displayed solution property pages dialog, select the check box Disable debugging experience improvements.
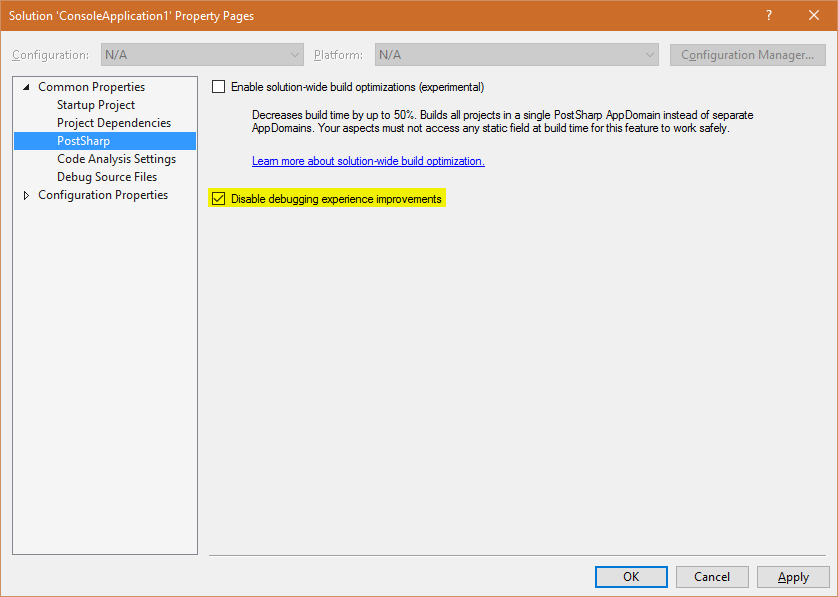
Confirm the change by clicking OK and then rebuild your solution.
Note
By default, debugging extensions are enabled when optimizations are disabled and debugging symbols are generated, typically in the Debug configuration, whether you build from Visual Studio or from the command line. They are disabled otherwise. To override this behavior, set the PostSharpDebuggerExtensionsMode MSBuild property to Enabled or Disabled.
Warning
If you build a solution with debugging extensions enabled, you must debug the solution with an instance of Visual Studio where debugging extensions are enabled. Otherwise, your debugging experience will be frustrating.